Access Data
California-Mexico Border Catalog
This page describes the resulted catalog accompanying the USGS Technical Report "Seismotectonics of the California-Mexico Border Region".
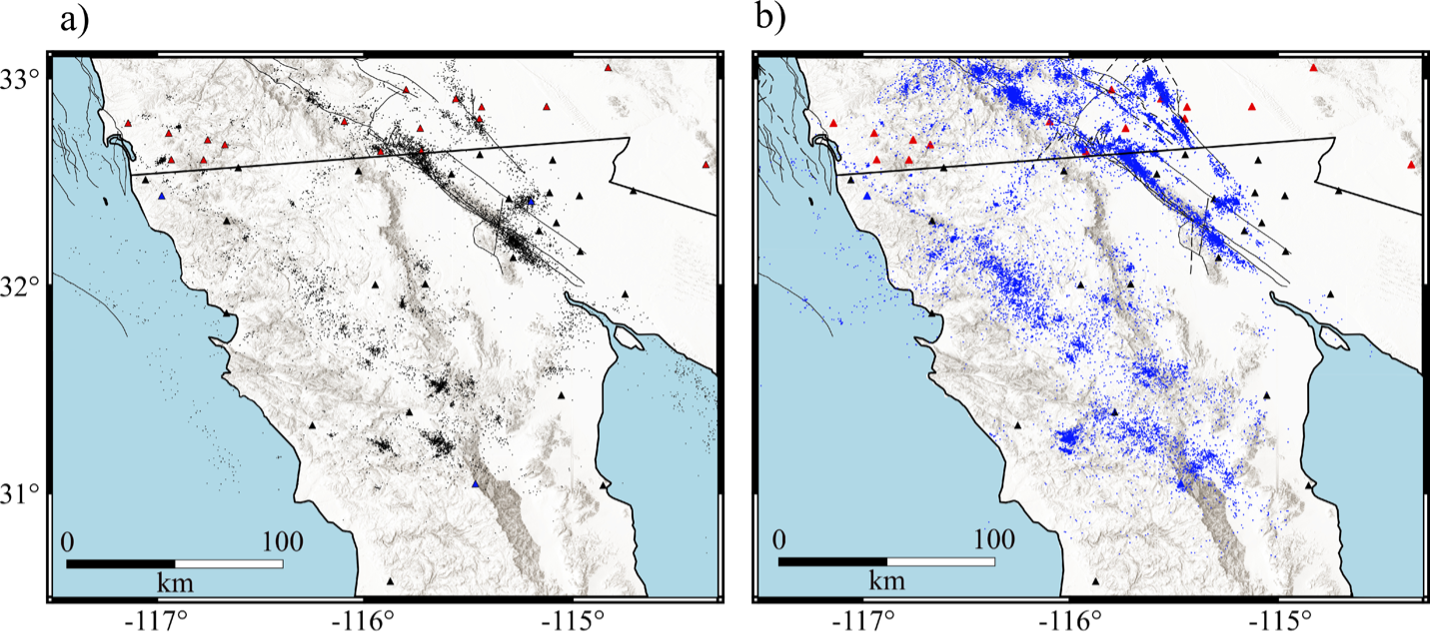
Figure 1. a) Seismicity reported by RESNOM from January 2012 to December 2020 (CICESE, 1980). b) Catalog from this study using PhaseLink system, NonLinLoc, and hypoDD. Traces of faults from CFM v5.3 (Evans et al. 2020) are represented as thin black lines. The thick black line is the international US-Mexico border. Station triangles are the same as in Fig. 1.
The columns are in HypoDD format:
| Column 1 | Event identification |
| Columns 2-4 | Latitude, longitude and depth (decimal degrees), and depth (km) |
| Columns 5-7 | East-west, north-south, depth location (m) relative to the cluster centroid. |
| Columns 8-10 | East-west, north-south, depth error (m). |
| Columns 11-13 | Origin date: Year, month, and day. |
| Columns 14-15 | Origin time: Hour, minute, and second. |
| Column 17 | Magnitude |
| Columns 18-19 | Number of cross-correlated P- and S-wave data. |
| Columns 20-21 | Number of catalog P- and S-wave data. |
| Columns 22-23 | RMS residuals for the cross-correlated and catalog data. |
| Column 24 | Cluster index. |
Files
Data and materials availability
The waveforms from SCSN are available from Caltech/USGS Southern California Seismic Network doi:10.7914/SN/CI; stored at the Southern California Earthquake Data Center, doi:10.7909/C3WD3xH1). Waveforms from RESNOM stations are available upon request through M. Alejandra Nuñez-Leal (anunez@cicses.mx). RESNOM catalog is located at https://resnom.cicese.mx/sitio/busqueda?i= (last accessed in May 2022). Waveforms of selected stations in northern Baja California from Servicio Sismológico Nacional (SSN) were downloaded from a public server using SSN-STP (http://web.gps.caltech.edu/~clay/MASEdir/MASEclient.html, last accessed in January 2022). Additional scripts used in this project can be found in https://github.com/erikramirez123/seisBC