Access Data
Special Data Sets
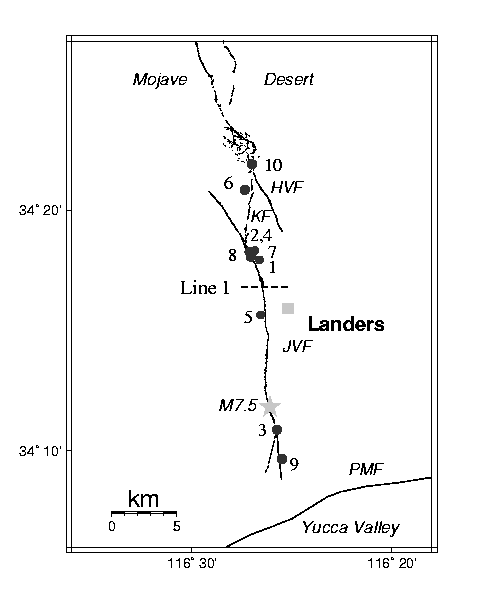
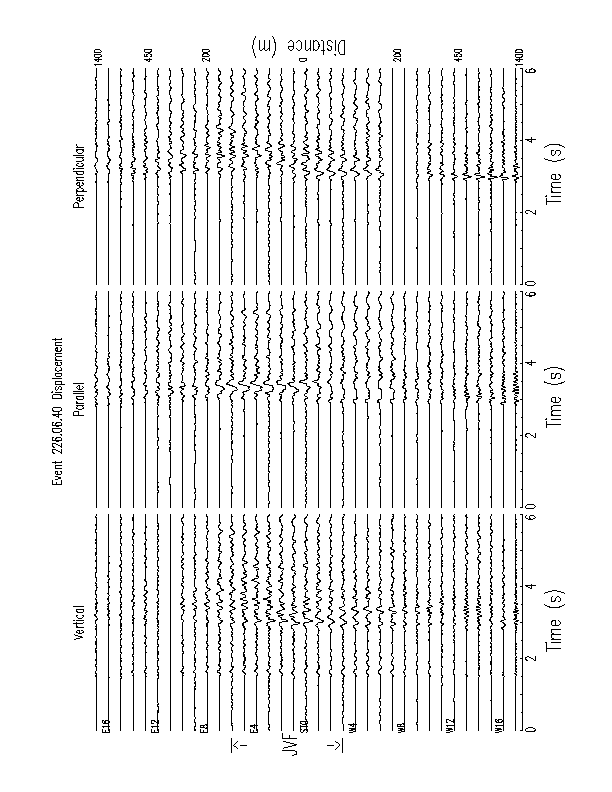
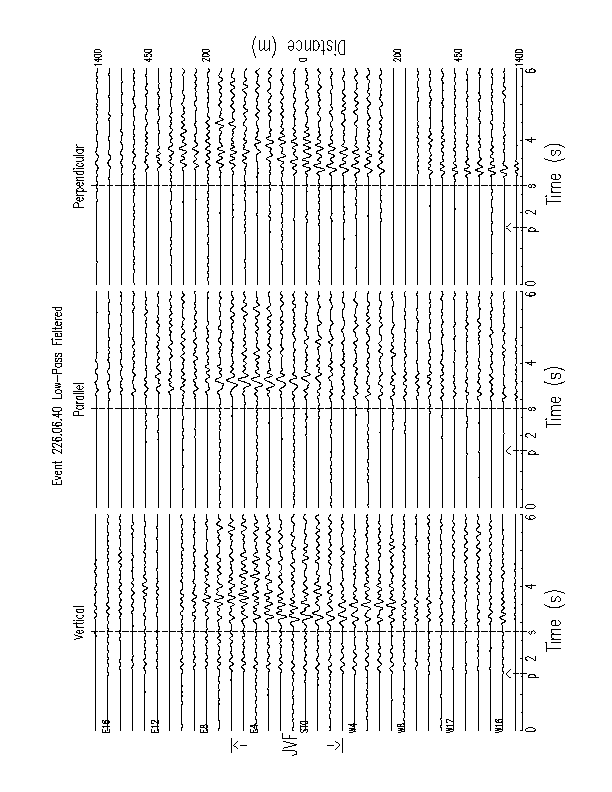
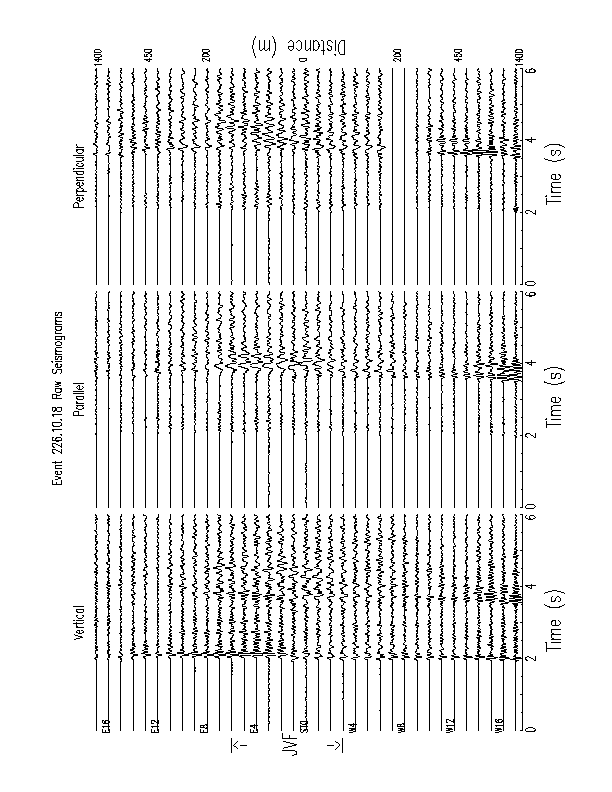
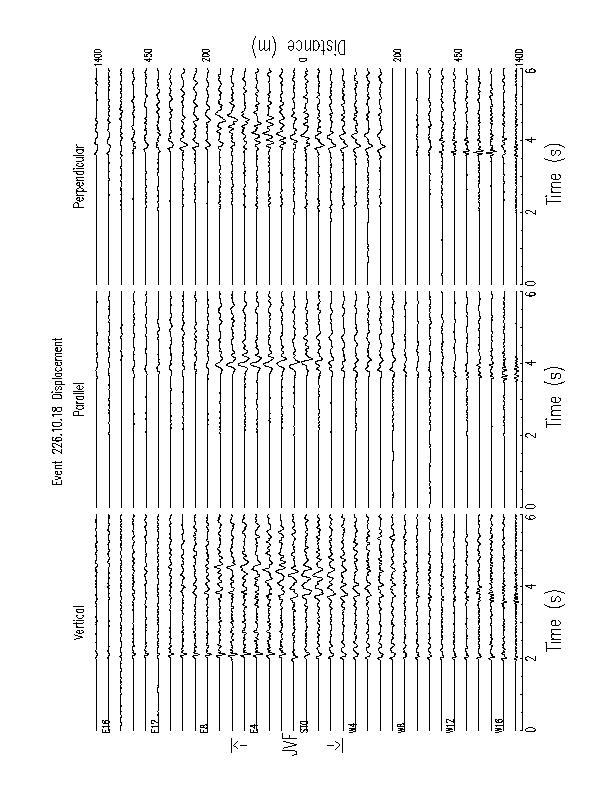
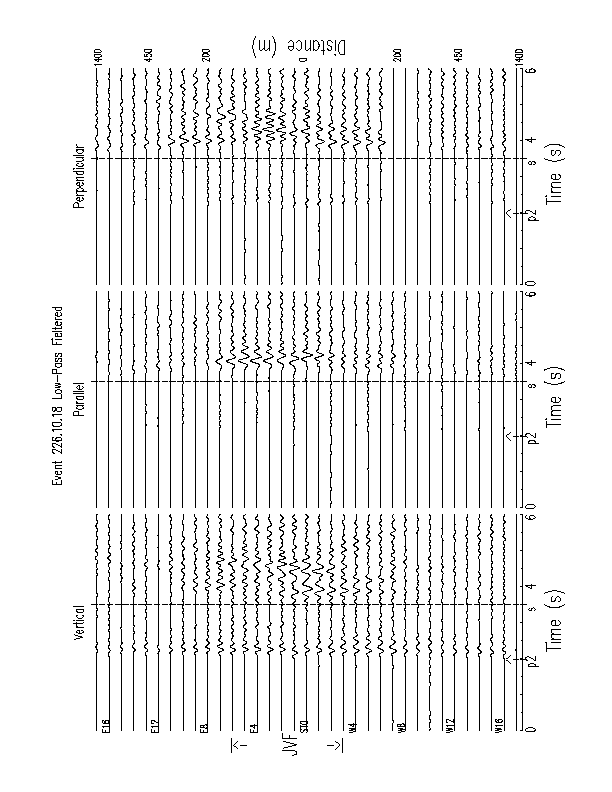
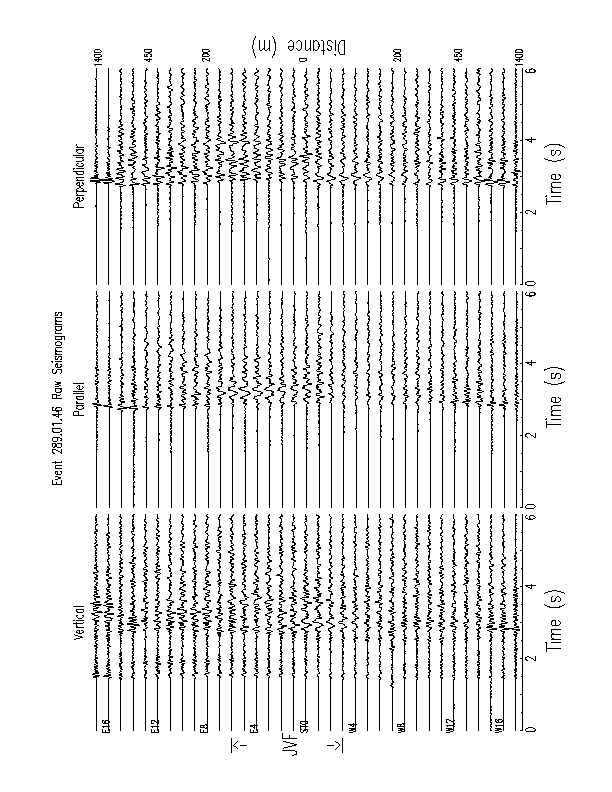
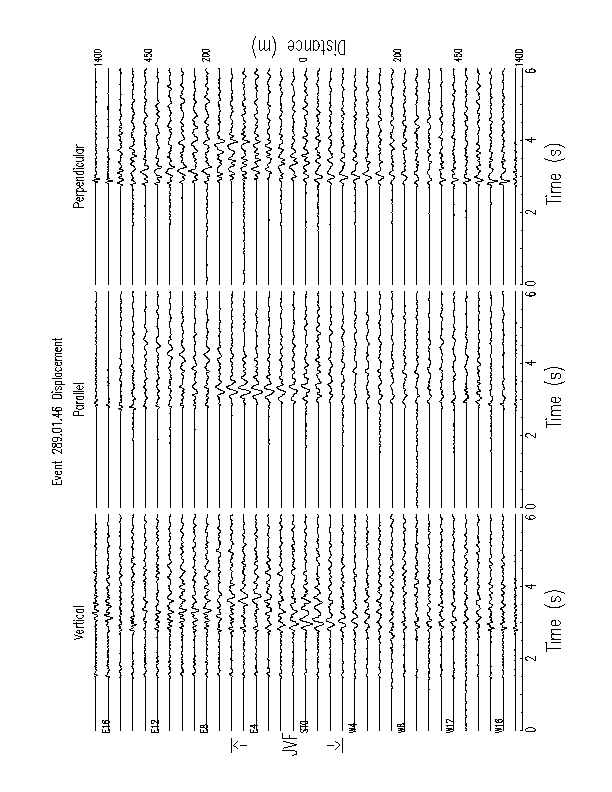
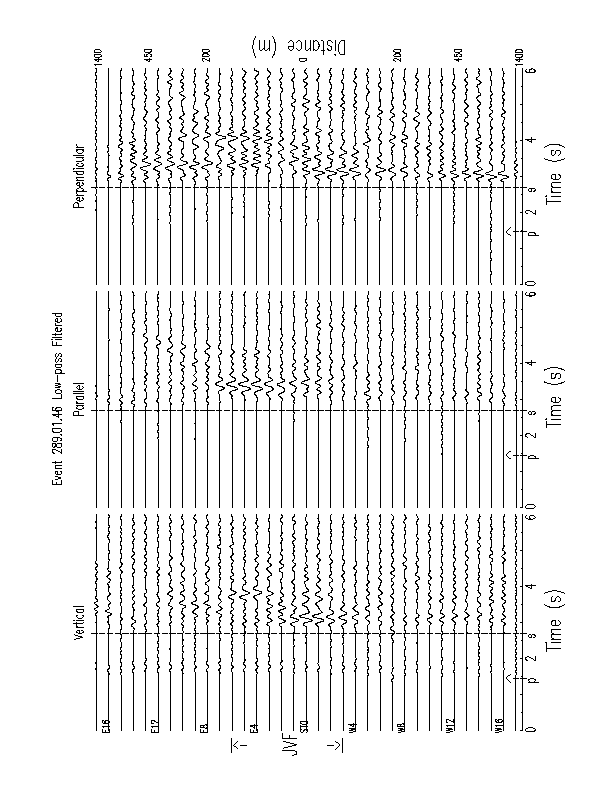
Fault-Zone Trapped-Waves
These data are contributed by Yong-Gang Li. The details can be found in the publication
Li, Y.G., J. E. Vidale, K. Aki, F. Xu and T. Burdette, Fault Zone Strengthening After the 1992 M7.5 Landers, California Earthquake, Science, 279, no.5348, pp217-219, 1998.
The locations of the events in the table are show on the Location Map. The last 5 columns having the follwing actions
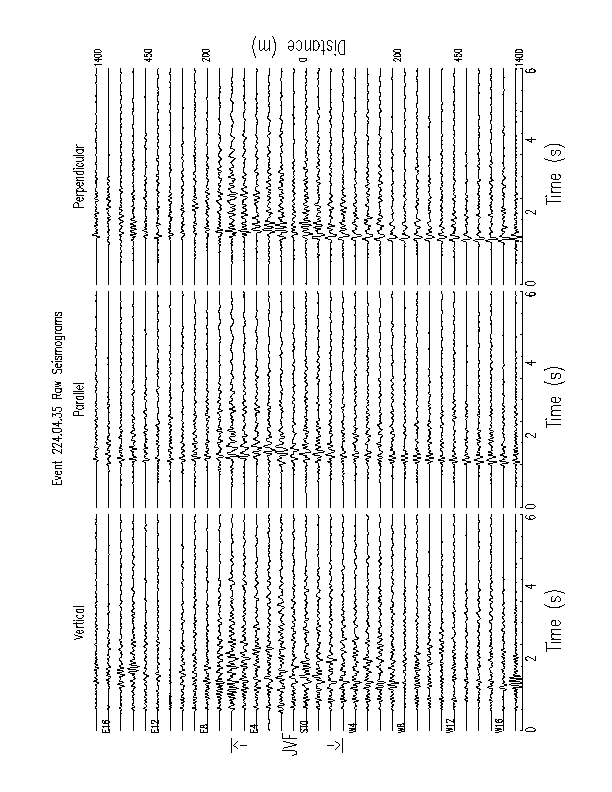
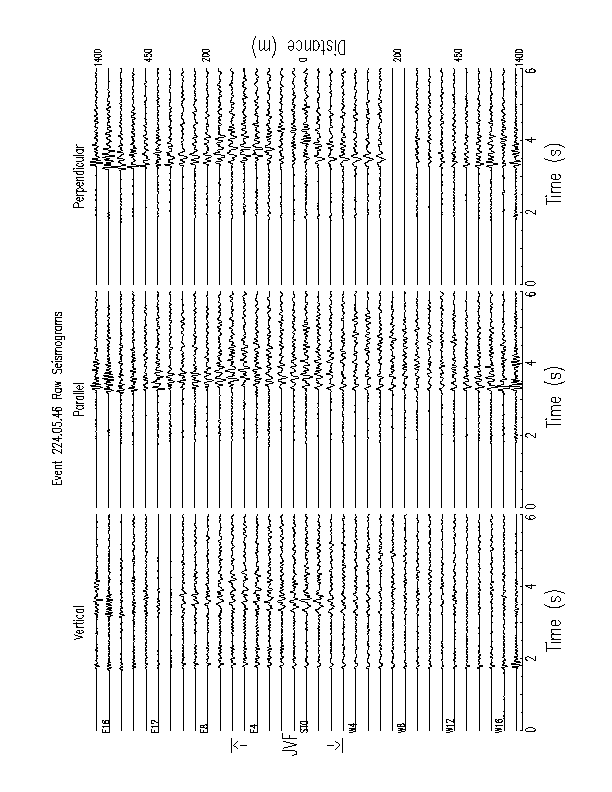
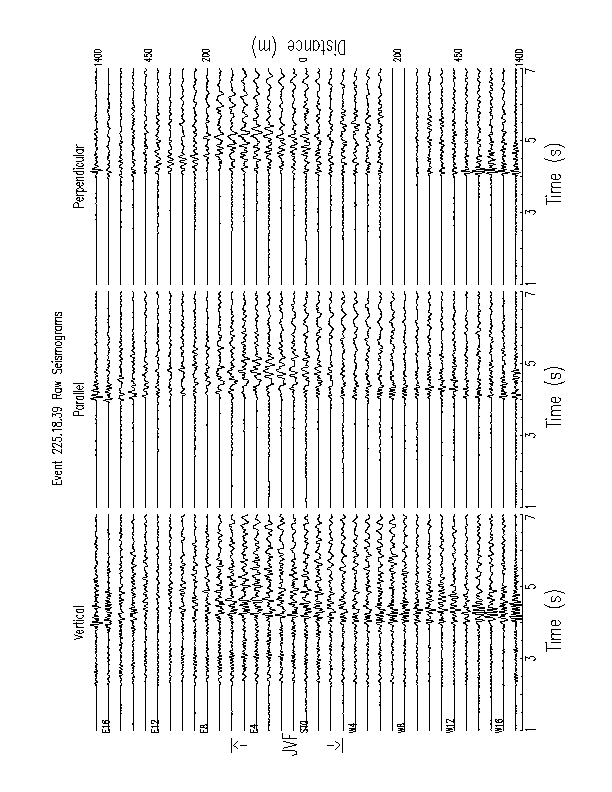
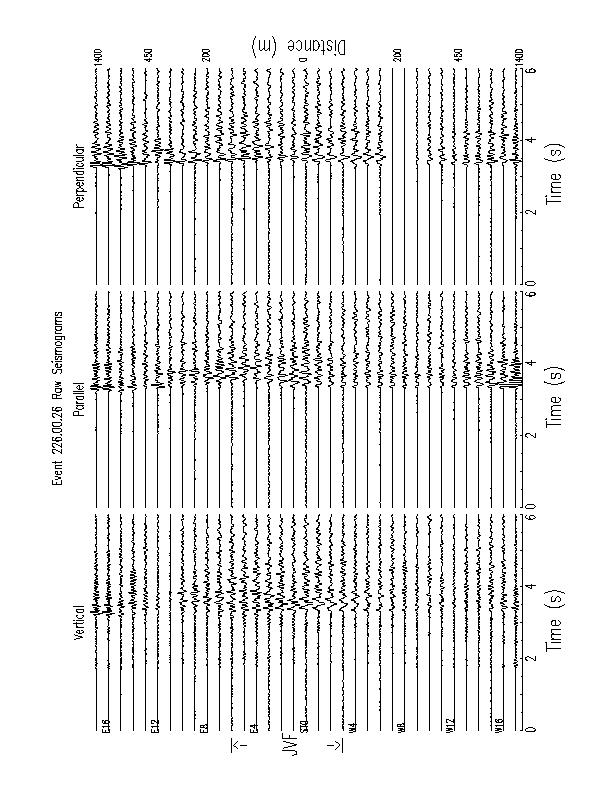
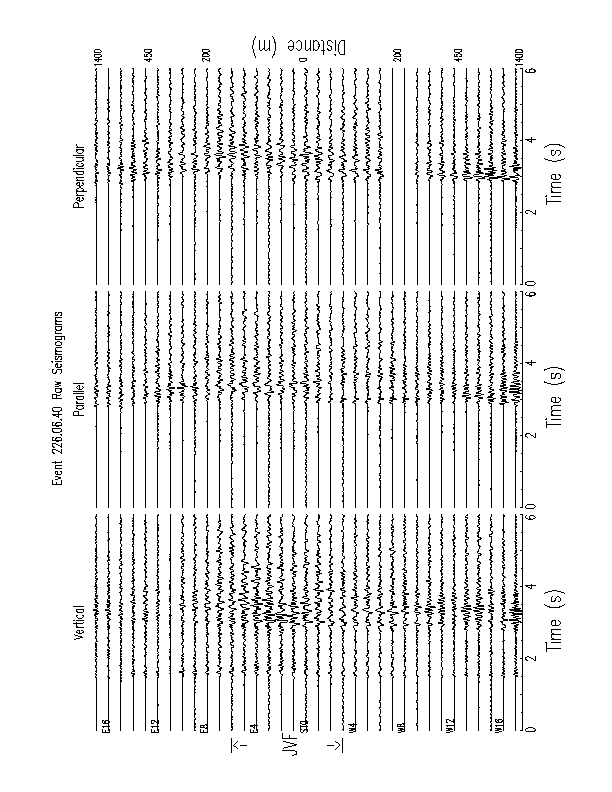
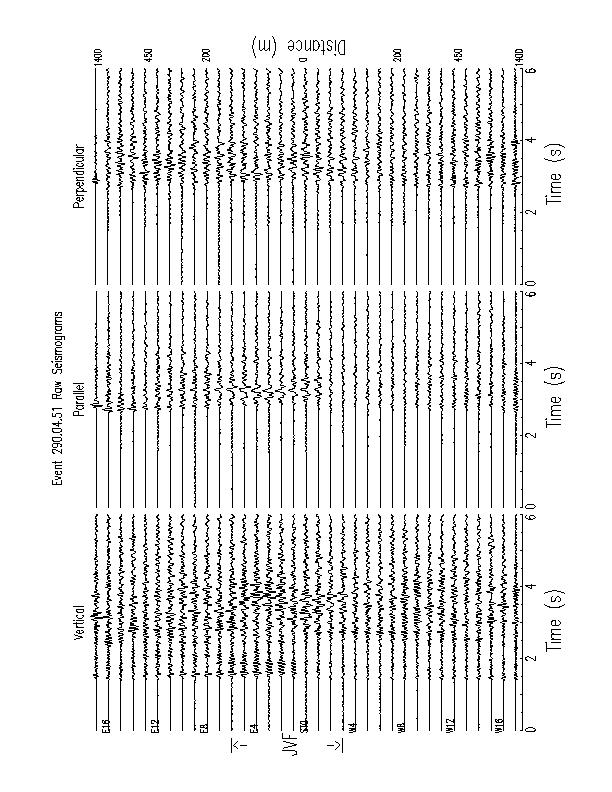
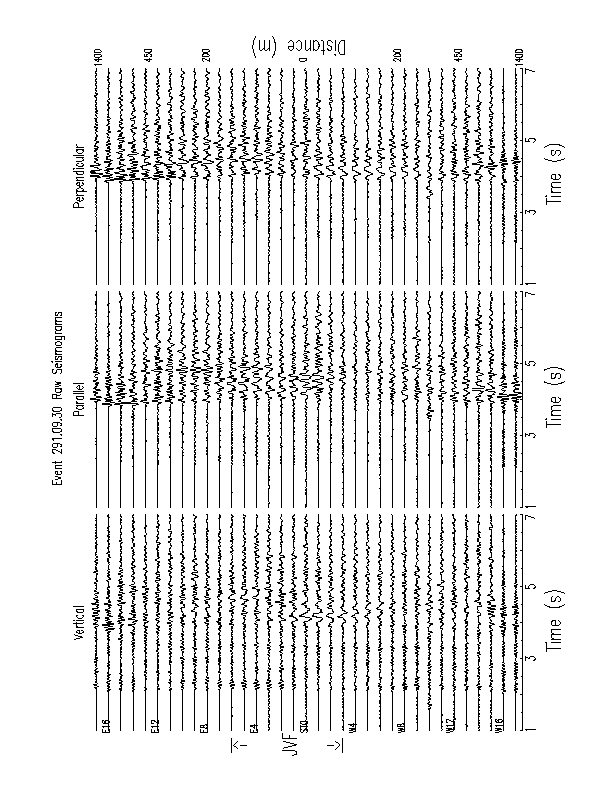
raw - plot of the raw data - gif-file
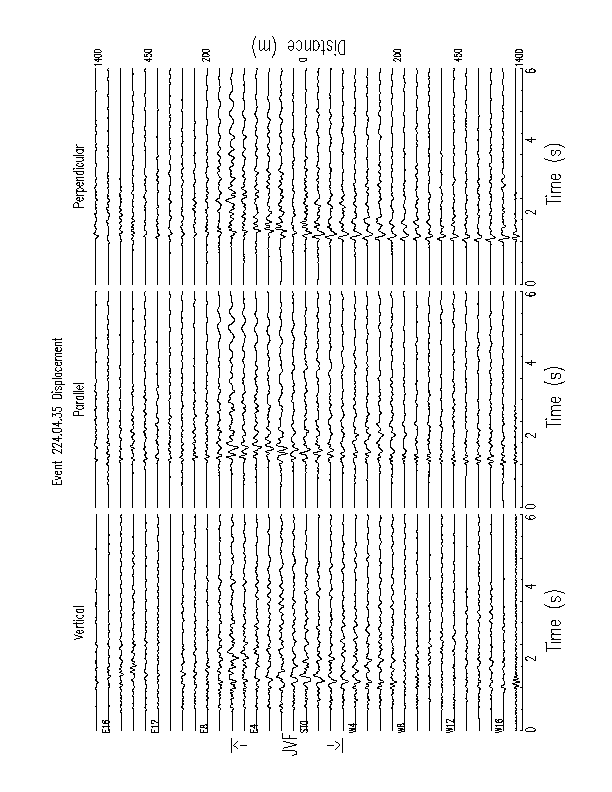
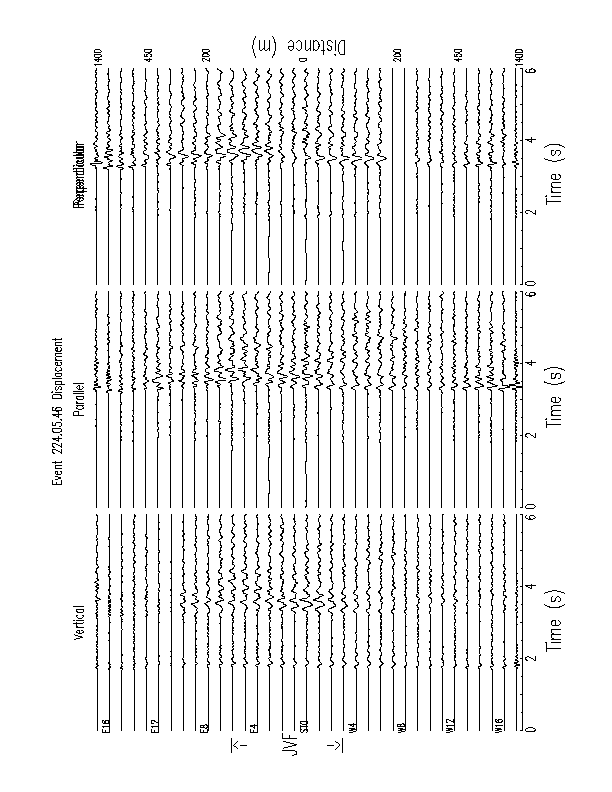
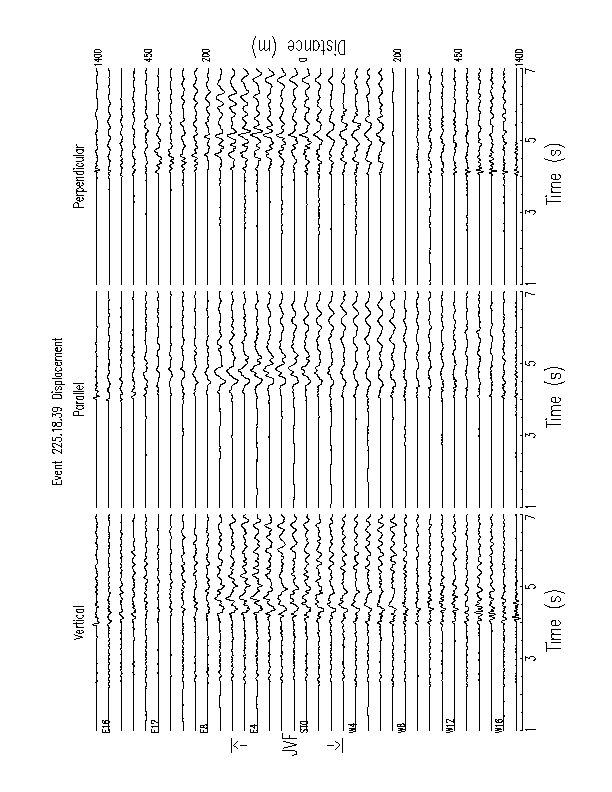
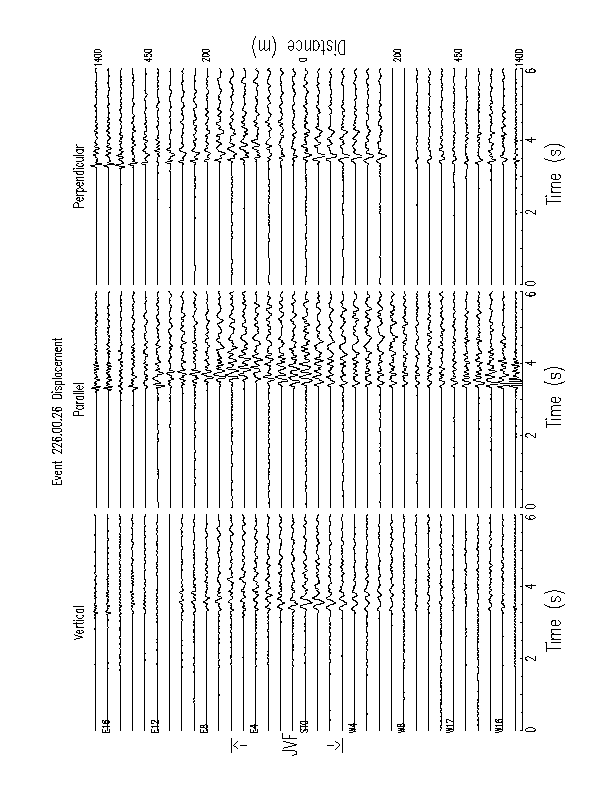
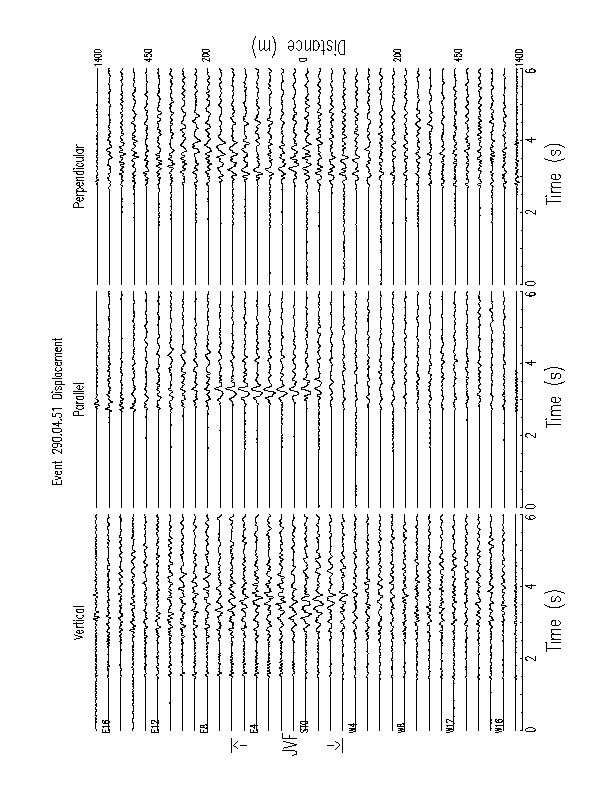
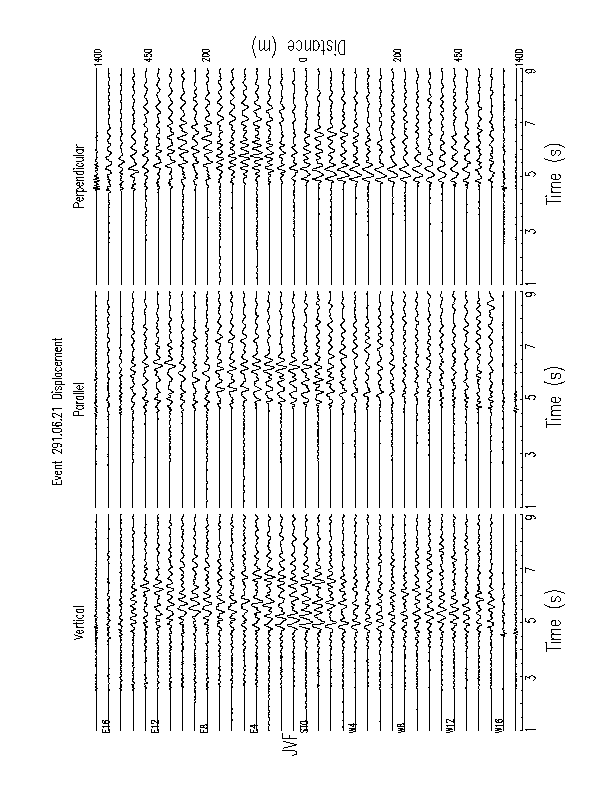
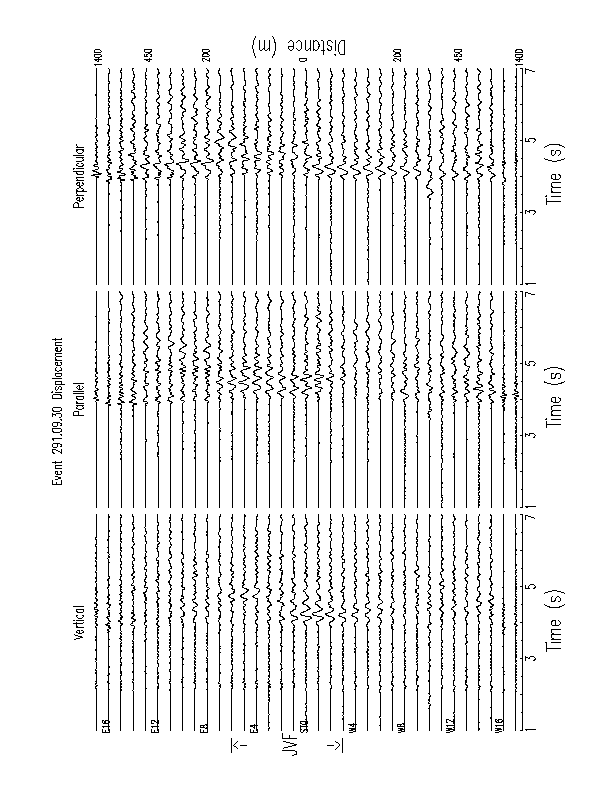
dis - plot of the displacement data - gif-file
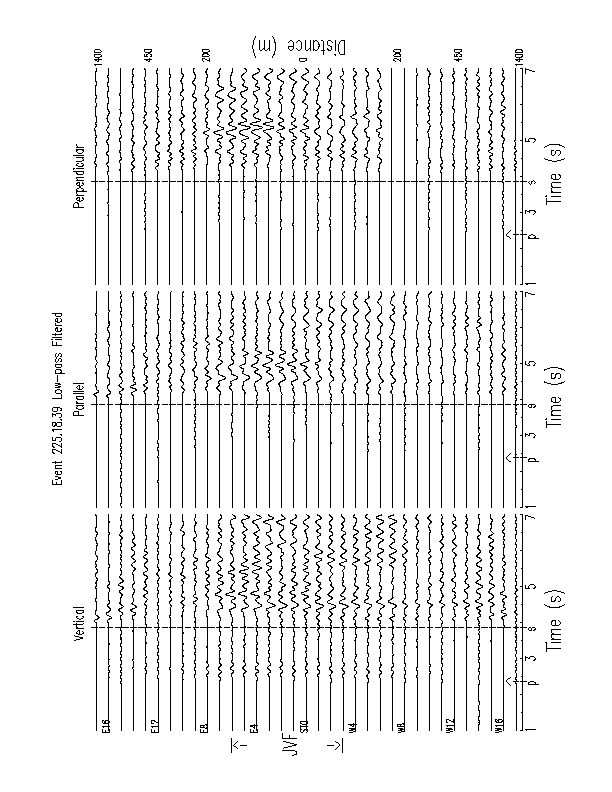
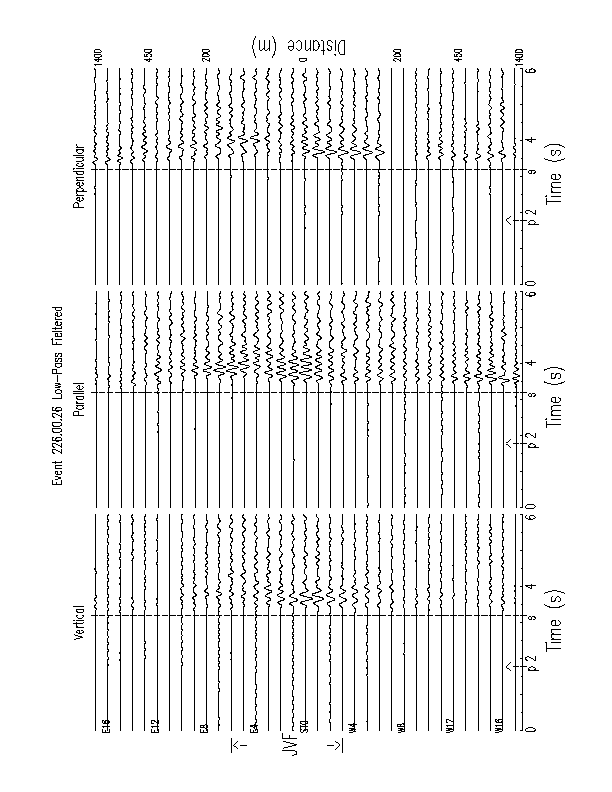
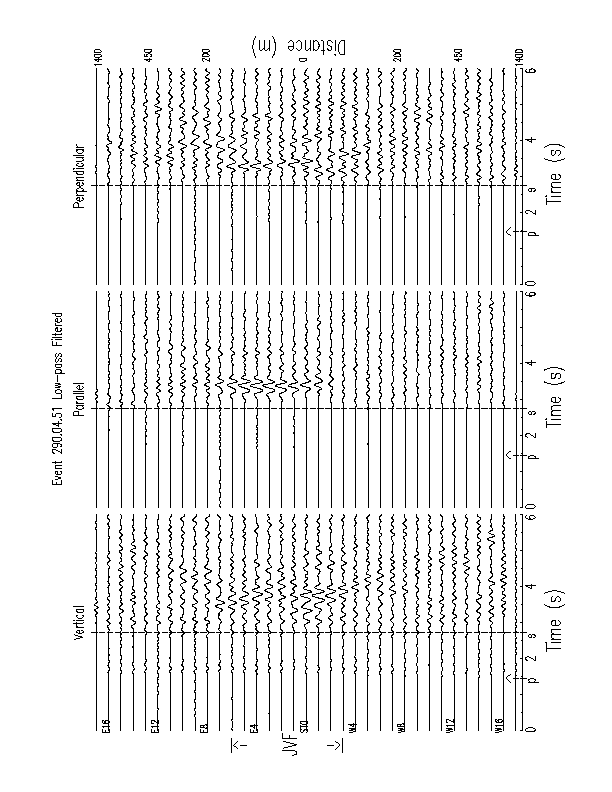
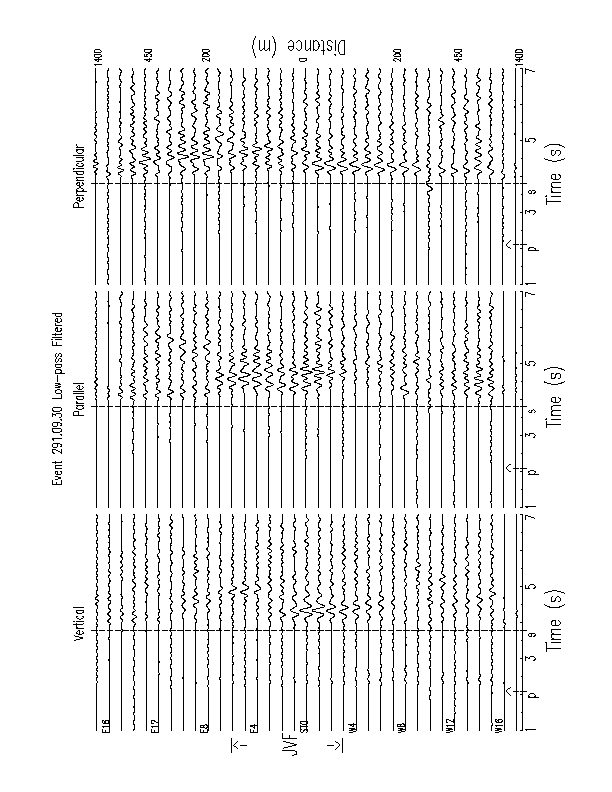
fil - plot of the filtered data - gif-file
data- download actual data for the event (SAC files in tar format).
PS figs- download postscipt version of the raw,dis and fil figs in ps format.
| # | jday | date | time | lat | lon | depth | mag | raw | dis | fil | data | PS figs |
| 1 | 224 | 96 08 11 | 0435:34.47 | 34 17.96 | 116 26.50 | 1.0 | 1.2 | A | B | C | D | E |
| 2 | 224 | 96 08 11 | 0546:46.38 | 34 18.31 | 116 26.86 | 8.01 | 1.9 | A | B | C | D | E |
| 3 | 225 | 96 08 12 | 1839:54.48 | 34 10.88 | 116 25.75 | 1.75 | 1.3 | A | B | C | D | E |
| 4 | 226 | 96 08 13 | 0026:23.81 | 34 18.26 | 116 26.64 | 8.16 | 1.3 | A | B | C | D | E |
| 5 | 226 | 96 08 13 | 0640:13.23 | 34 15.65 | 116 26.66 | 5.50 | 1.0 | A | B | C | D | E |
| 6 | 226 | 96 08 13 | 1018:25.07 | 34 20.83 | 116.27.56 | 3.20 | 1.5 | A | B | C | D | E |
| 7 | 289 | 97 10 16 | 0146:46.38 | 34 18.25 | 116.27.02 | 6.20 | 1.9 | A | B | C | D | E |
| 8 | 290 | 97 10 17 | 0451:21.23 | 34 18.27 | 116.27.34 | 4.85 | 1.3 | A | B | C | D | E |
| 9 | 291 | 97 10 18 | 0621:22.75 | 34 09.72 | 116 25.49 | 3.50 | 1.2 | A | B | C | D | E |
| 10 | 291 | 97 10 18 | 0930:14.02 | 34 21.85 | 116 27.00 | 6.77 | 1.0 | A | B | C | D | E |